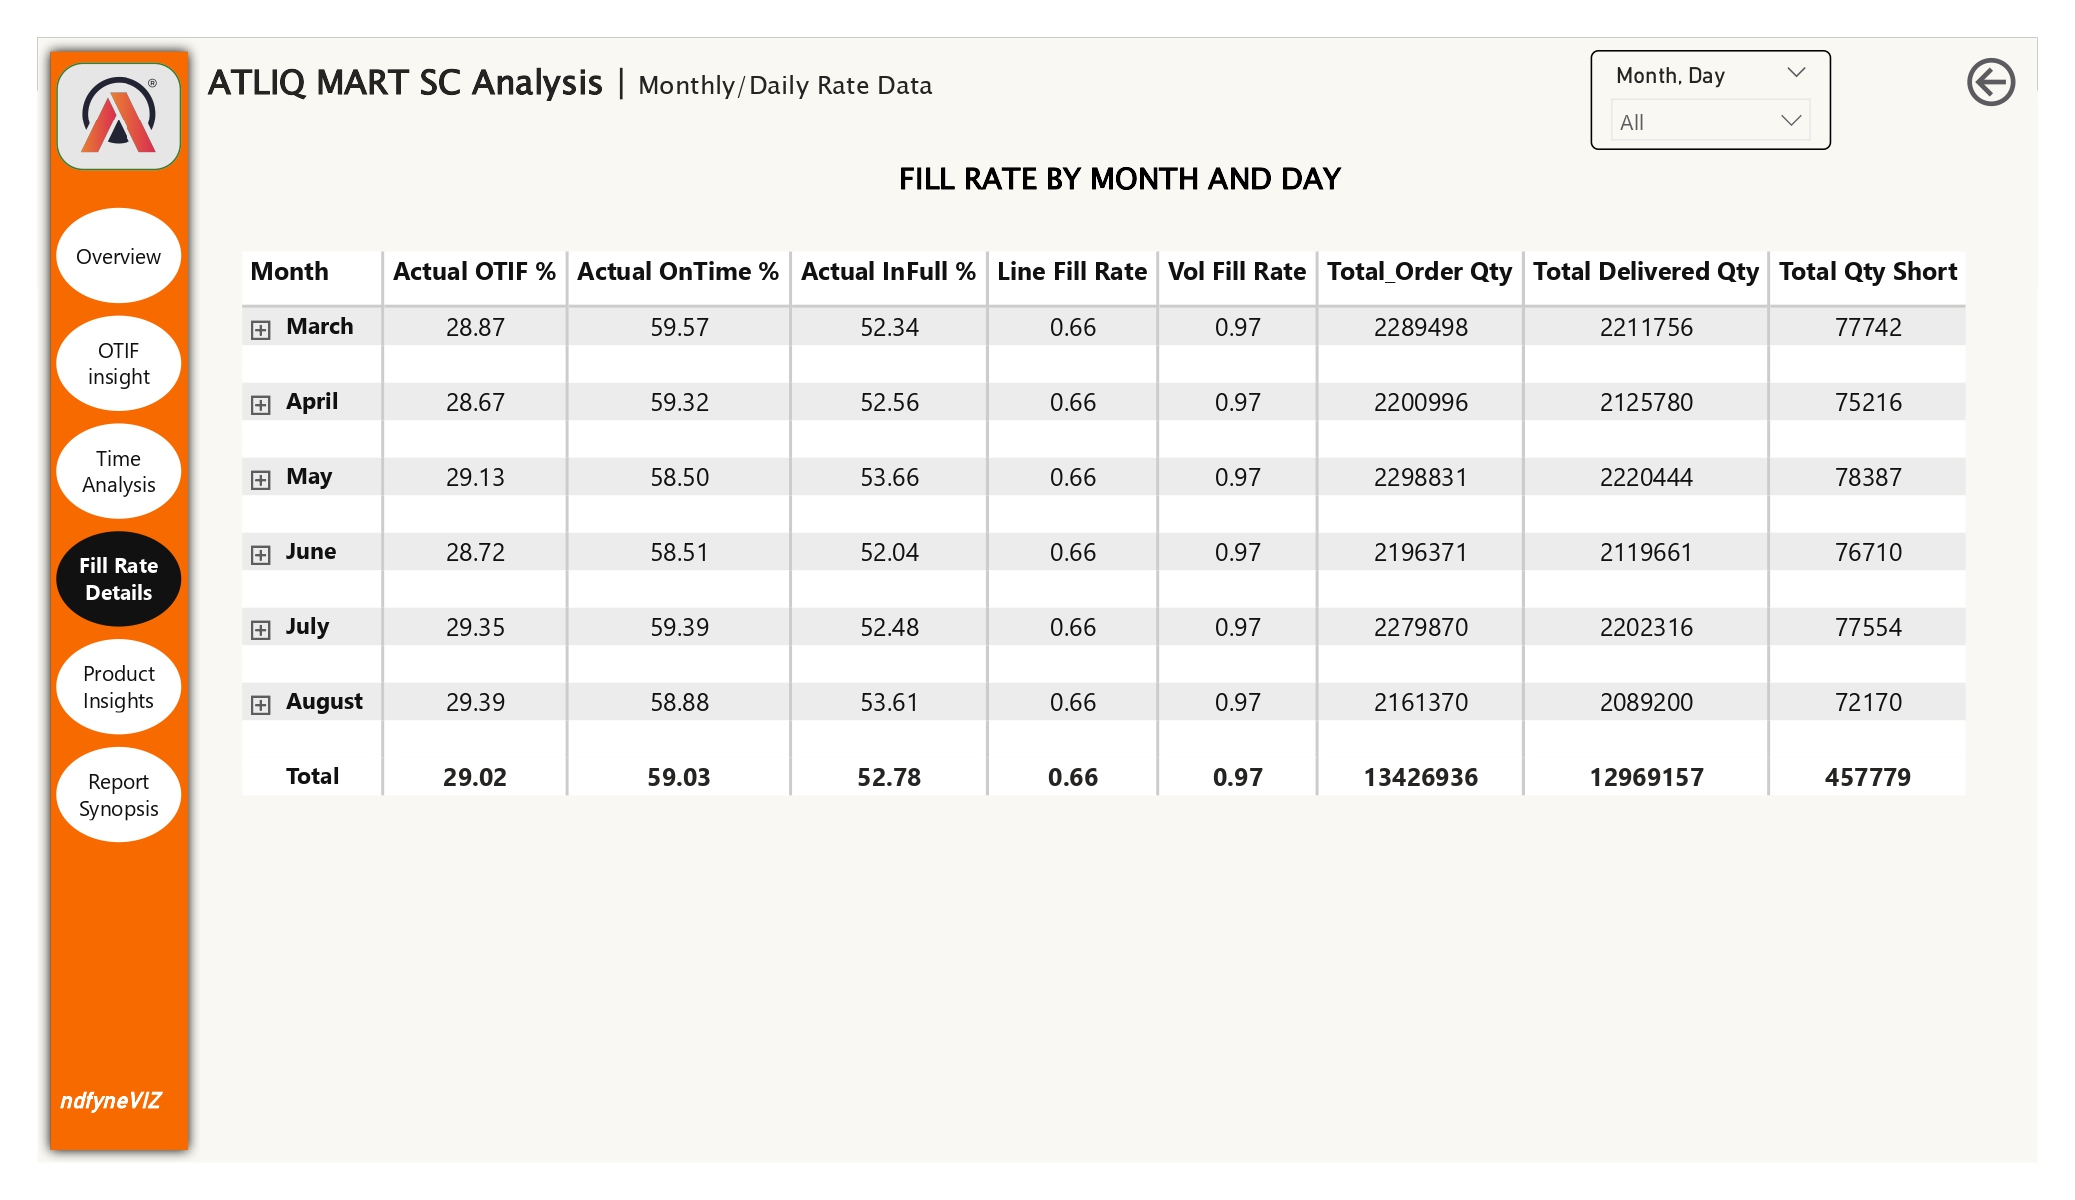
Problem Statement Atliq Mart is facing significant challenges in meeting customer service expectations across key supply chain metrics. The leadership has observed consistently poor performance in On Time, In Full, and OTIF (On Time In Full) delivery rates, especially across critical customer accounts and regions. A lack of real-time visibility into these service levels has resulted in dissatisfied customers and the risk of contract non-renewals. Despite previous budget constraints delaying the implementation of service-level analytics, leadership has now approved the development of a comprehensive Power BI dashboard. This dashboard must help the supply chain and business teams understand performance trends across cities, customers, and products, and diagnose root causes of poor service levels such as order shortages, late deliveries, or unfulfilled order lines.
Expected Outcome:
A dynamic Power BI dashboard that:
Displays On Time, In Full, and OTIF % metrics by customer, city, and month.
Visualizes gaps against targets for each metric using conditional formatting in a matrix view.
Allows users to switch between metrics (OTIF, LIFR, VOFR) and drill down from month to week or day.
Includes product-level insights on Line Fill Rate (LIFR) and Volume Fill Rate (VOFR), using sparklines or trend visuals.
Business value:
Identifies high-risk customers and regions with persistently low service performance.
Enables supply chain managers to take data-driven action to improve fill rates, delivery timing, and inventory planning.
Supports executive decision-making to reduce customer churn, improve operational efficiency, and strengthen service reliability.